
TL;DR — Build a
usage_eventstable (tenant, model, tokens, cost, tags), write 3 SQL queries (daily trend, model breakdown, per-feature), and add a budget alert. Or skip 2–4 weeks of engineering and use Tokonomics — it gives you all seven views out of the box with zero backend code.
Key Takeaways
- 72% of organizations use AI but most have zero per-feature cost visibility (McKinsey, 2024)
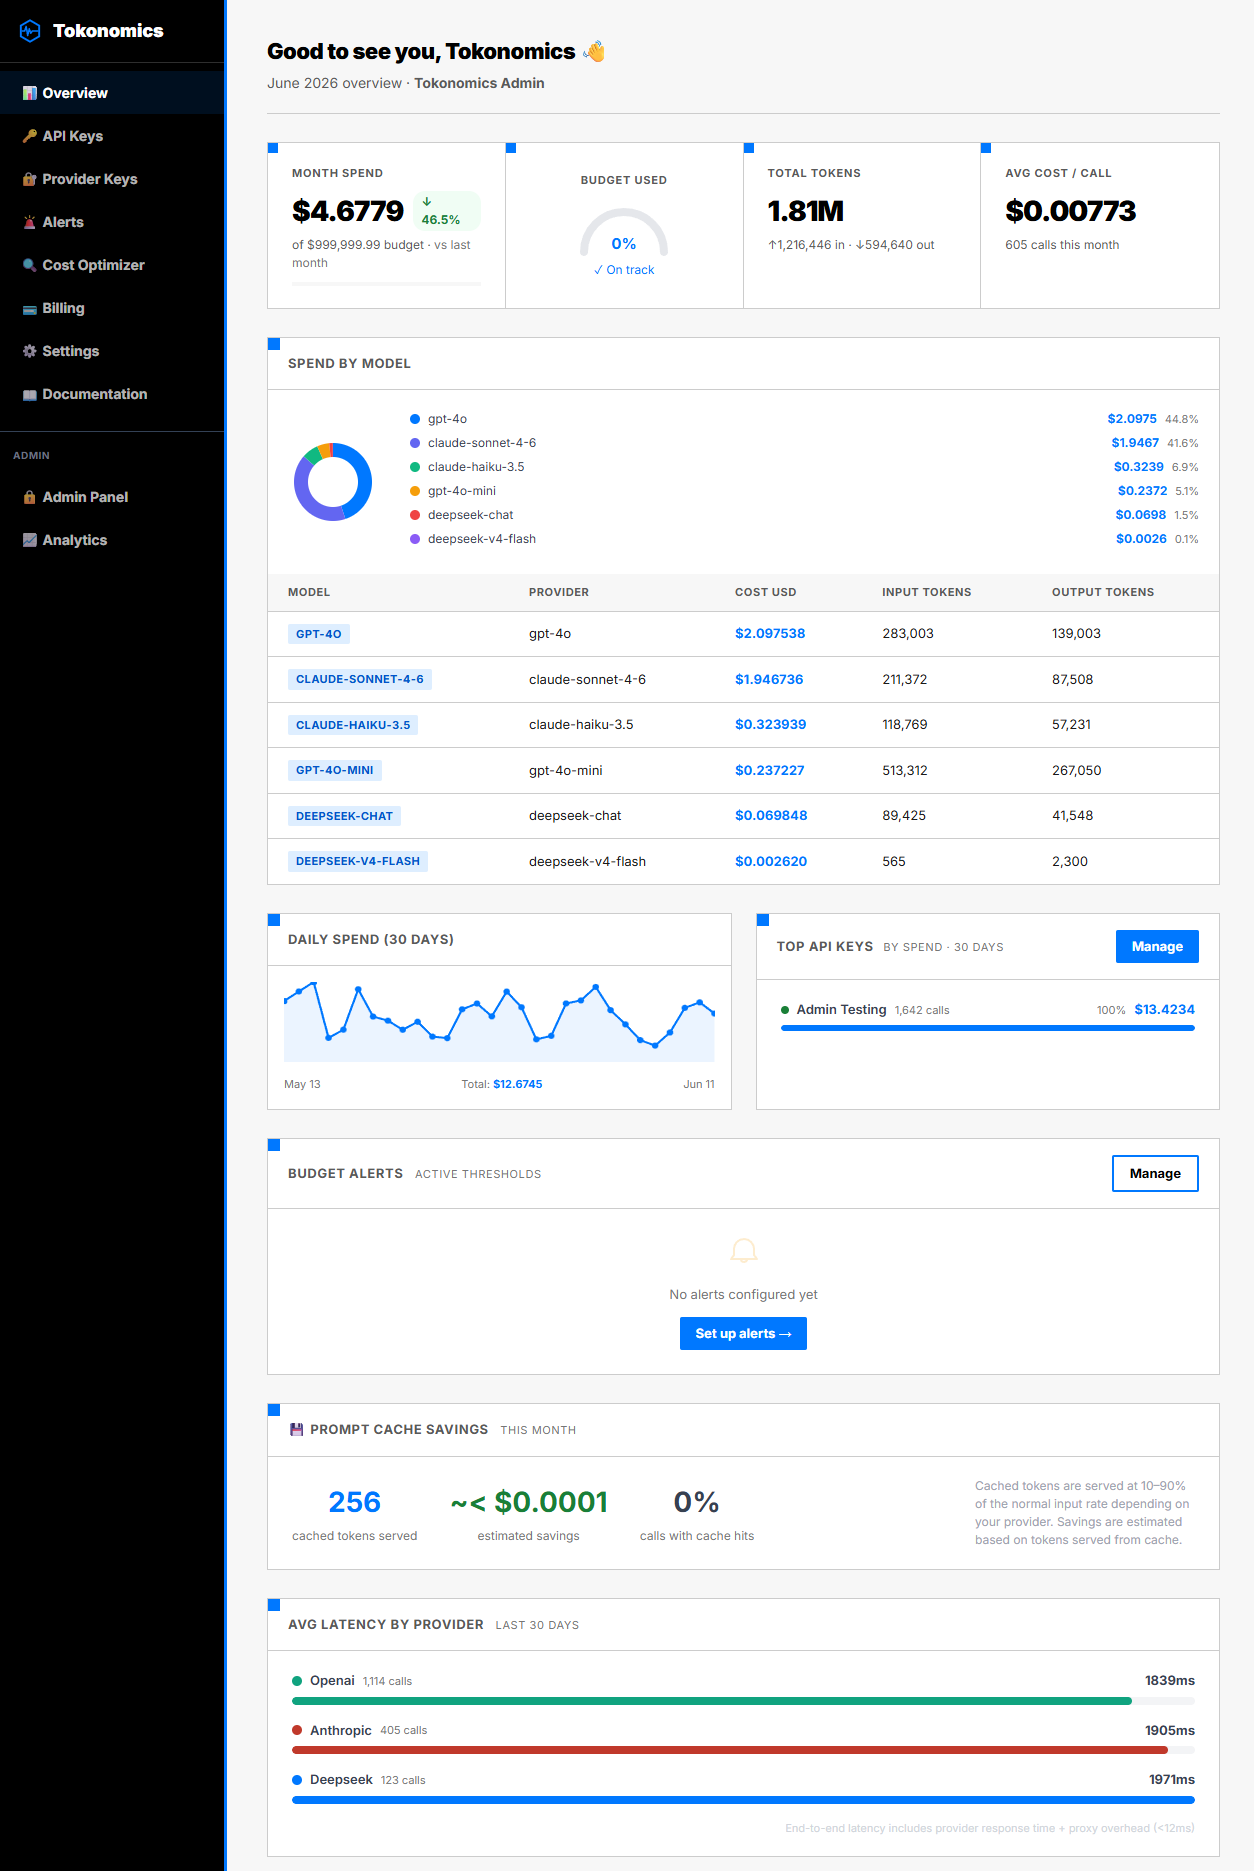
- A useful AI cost dashboard needs 7 views: total spend, daily trend, by model, by feature/team, cost per request, budget alerts, and top consumers
- Building from scratch takes 2–4 weeks of engineering — schema design, SQL queries, charts, and alerting
- A metering proxy like Tokonomics provides all 7 views out of the box with zero backend code
Every team using LLM APIs eventually needs a cost dashboard. The trigger is always the same — someone in leadership asks "how much are we spending on AI and where is it going?" and nobody has an answer. McKinsey's State of AI 2024 found that 72% of organizations now use AI in at least one business function, yet the majority have no per-feature cost visibility — making AI one of the fastest-growing and least-understood line items in infrastructure budgets.
Provider dashboards (OpenAI's usage page, Anthropic's console) show total spend. They don't show spend by feature, by team, by customer, or by environment. They don't let you set alerts. They don't correlate cost with business metrics. For anything beyond "how much did we spend total," you need your own dashboard.
This article covers two paths: building one from scratch (with the schema, queries, and architecture) and using a proxy that gives you one out of the box. The right choice depends on how much engineering time you want to invest.
What should a useful AI cost dashboard show?
Before building anything, define what you need to see. Most teams need these seven views:
- Total spend this month — the number your CFO asks about
- Daily spend trend — a 30-day line chart that shows whether costs are stable or climbing
- Spend by model — which models consume the most budget
- Spend by feature/team — which product feature or team is responsible for each dollar
- Cost per request — average cost, trending over time
- Token breakdown — input vs output tokens, because they're priced differently
- Budget utilization — current spend as a percentage of your monthly budget
Advanced teams also want:
- Latency by provider — are you paying more for a slower service?
- Cost per end-user action — what does each chatbot conversation or AI-generated report cost?
- Anomaly detection — flag days where spend exceeds 2x the daily average
How do you build an AI cost dashboard yourself?
If you want full control and have engineering bandwidth, here's the architecture.
The data model
You need one table that logs every LLM API call:
CREATE TABLE llm_usage_events (
    id          CHAR(36) PRIMARY KEY,
    model       VARCHAR(100),       -- gpt-4o, claude-sonnet-4, etc.
    provider    VARCHAR(50),        -- openai, anthropic, deepseek
    input_tokens  INT UNSIGNED,
    output_tokens INT UNSIGNED,
    cost_usd    DECIMAL(12,8),      -- never use FLOAT for money
    latency_ms  INT UNSIGNED,
    tags        JSON,               -- {"team":"growth","feature":"chatbot"}
    api_key_id  CHAR(36),
    created_at  DATETIME
);

CREATE INDEX idx_usage_created ON llm_usage_events(created_at);
CREATE INDEX idx_usage_model ON llm_usage_events(model);
The tags column is critical. It lets you slice costs by any dimension — team, feature, customer, environment — without adding columns for each. Pass tags as a JSON header with every LLM call and store them alongside the usage data.
For a deep dive on per-feature tagging, see our guide on per-feature LLM cost tracking.
The interception layer
You need to capture usage data from every LLM call. Three approaches:
Wrapper function. Wrap your LLM client in a function that records usage before returning the response:
def tracked_completion(messages, model="gpt-4o", tags=None):
    start = time.time()
    response = openai.chat.completions.create(
        model=model,
        messages=messages
    )
    latency_ms = int((time.time() - start) * 1000)

    usage = response.usage
    cost = calculate_cost(model, usage.prompt_tokens,
                          usage.completion_tokens)

    db.execute(
        "INSERT INTO llm_usage_events (...) VALUES (...)",
        model, "openai", usage.prompt_tokens,
        usage.completion_tokens, cost, latency_ms,
        json.dumps(tags or {})
    )

    return response
This works but requires changing every call site. If you have 15 places that call OpenAI, you need to update all 15.
HTTP proxy. Route all LLM traffic through a reverse proxy that intercepts responses and extracts usage data. Your app doesn't change — you change the base URL:
# Before
client = OpenAI()

# After — route through your proxy
client = OpenAI(base_url="https://your-proxy.internal/openai/v1")
The proxy forwards the request, reads the usage object from the response, logs it, and passes the response through. This is the approach Tokonomics uses — and it's language-agnostic, so it works with Python, Node.js, Go, Ruby, or any HTTP client.
Provider webhooks. Some providers offer usage webhooks or export APIs. OpenAI doesn't currently offer real-time webhooks for usage, so this approach has delays and gaps.
The cost calculation
Maintaining accurate per-model pricing is tedious but necessary:
COST_PER_MILLION = {
    "gpt-4o":        {"input": 2.50, "output": 10.00},
    "gpt-4o-mini":   {"input": 0.15, "output": 0.60},
    "claude-sonnet-4-20250514": {"input": 3.00, "output": 15.00},
    "claude-haiku-3-5-20241022": {"input": 0.80, "output": 4.00},
    "deepseek-chat": {"input": 0.27, "output": 1.10},
}

def calculate_cost(model, input_tokens, output_tokens):
    rates = COST_PER_MILLION.get(model, {"input": 0.15, "output": 0.60})
    return (input_tokens * rates["input"] +
            output_tokens * rates["output"]) / 1_000_000
You need to update this every time a provider changes pricing. OpenAI has changed GPT-4o pricing twice in the last year. Miss an update and your dashboard shows wrong numbers. For current rates across all providers, see our LLM API pricing guide.
The dashboard queries
With data flowing in, here are the SQL queries that power each widget:
Monthly spend:
SELECT SUM(cost_usd) AS total_spend
FROM llm_usage_events
WHERE created_at >= DATE_FORMAT(NOW(), '%Y-%m-01');
Daily trend (30 days):
SELECT DATE(created_at) AS day, SUM(cost_usd) AS spend
FROM llm_usage_events
WHERE created_at >= DATE_SUB(NOW(), INTERVAL 30 DAY)
GROUP BY DATE(created_at)
ORDER BY day;
Spend by model:
SELECT model, SUM(cost_usd) AS spend, COUNT(*) AS requests
FROM llm_usage_events
WHERE created_at >= DATE_FORMAT(NOW(), '%Y-%m-01')
GROUP BY model
ORDER BY spend DESC;
Spend by feature (using JSON tags):
SELECT JSON_UNQUOTE(JSON_EXTRACT(tags, '$.feature')) AS feature,
       SUM(cost_usd) AS spend
FROM llm_usage_events
WHERE created_at >= DATE_FORMAT(NOW(), '%Y-%m-01')
GROUP BY feature
ORDER BY spend DESC;
The maintenance burden
Building a cost dashboard is a weekend project. Maintaining it is an ongoing commitment. The Flexera 2025 State of the Cloud Report found that 82% of enterprises cite cloud cost management as their top challenge — and internal tooling that falls behind provider pricing changes is a leading contributor to that problem.
- Pricing updates — provider pricing changes quarterly; you need to update your rate table
- New models — every few months a new model launches; add it to your config or costs show as $0
- Schema migrations — as your needs grow, you'll add columns and indexes
- Performance — at scale (millions of events/month), raw queries slow down; you'll need rollup tables
- Multi-provider — if you use OpenAI and Anthropic, you need to normalize response formats
Expect 2-4 hours/month of maintenance to keep the dashboard accurate and fast.
Why use a proxy with a built-in dashboard instead?
If you'd rather spend engineering time on your product instead of building internal tooling, a metering proxy gives you everything above out of the box.
Tokonomics is a proxy built specifically for this. Change your LLM base URL, add a Tokonomics API key, and you get:
- All seven dashboard views listed above — spend, trends, model breakdown, per-feature tags, budget gauge
- Multi-provider — OpenAI, Anthropic, DeepSeek, and any OpenAI-compatible API in one dashboard
- Budget alerts at configurable thresholds (setup guide)
- Hard spending caps that block requests when budget is exceeded (how caps work)
- Per-key analytics — each API key gets its own usage breakdown
- Zero maintenance — pricing tables are updated automatically when providers change rates
The integration takes 5 minutes. You change one URL and add one header. Your app code, your prompts, your logic — nothing else changes. See the getting started guide for the exact steps.
What is the honest build vs buy tradeoff?
| Factor | Build yourself | Use Tokonomics |
|---|---|---|
| Setup time | 2-3 days | 5 minutes |
| Monthly maintenance | 2-4 hours | 0 |
| Customization | Unlimited | Dashboard + API |
| Multi-provider | You build it | Built in |
| Budget alerts | You build it | Built in |
| Hard caps | You build it | Built in |
| Cost | Your engineer's time | $49/month (Pro) |
| Data ownership | Your database | Your data, our dashboard |
Build it yourself if you have unusual requirements — custom business logic, proprietary metrics, integration with internal BI tools. Use a proxy if you want the standard set of cost analytics without the engineering overhead.
Most teams start by building a basic dashboard, realize the maintenance burden after 2-3 months, and switch to a managed solution. Starting with the managed solution skips that detour. According to Gartner (2024), 30% of generative AI projects are abandoned after proof-of-concept, often because teams underestimate the operational overhead of the surrounding tooling — internal cost dashboards included.
Frequently Asked Questions
How much does it cost to build a custom AI cost dashboard?
A basic dashboard takes 2-3 days of engineering time to build, plus 2-4 hours per month in maintenance for pricing updates and new models. At average senior developer rates, that's roughly $3,000-5,000 upfront and $500-1,000 annually. A managed proxy solution typically costs $49/month with zero maintenance overhead.
What's the most important metric to track on an AI cost dashboard?
Cost per feature is the single most actionable metric. According to Andreessen Horowitz, AI infrastructure typically consumes 20-40% of revenue for AI-first companies. Breaking that down by feature tells you which parts of your product are profitable and which need cost optimization.
Can I track costs across multiple LLM providers in one dashboard?
Yes, but it requires normalizing different response formats. OpenAI, Anthropic, and Google each return token counts differently. A proxy-based approach intercepts all calls regardless of provider and logs them in a unified schema, giving you one view across all providers without custom parsing per API.
What should you do right now?
If you have no cost visibility today:
- Start logging. Even a simple table with model, tokens, and cost per call gives you more than provider dashboards alone.
- Add tags. Tag every LLM call with the feature and team that triggered it. This is the foundation for all useful analysis.
- Set one alert. A single budget alert at 80% of your monthly target catches problems before they become invoices.
- Review monthly. A 30-minute monthly audit turns raw data into decisions.
The teams that control their AI costs are the ones that can see them. Dashboard first. Optimization follows.
Last updated June 2026. All sources retrieved June 2026. Key external sources: McKinsey State of AI 2024 | Flexera 2025 State of the Cloud Report | Gartner GenAI Predictions 2024.